Hurricane Emily
August 22-September 6, 1993
Hurricane Emily threatened North Carolina as a category 3 storm,
but fortunately was pushed out to sea before moving inland. It
is notable for the length of time (eight days) it remained at
hurricane strength. Damages of $35 million resulted primarily
from flooding and the storm tide.
Ocean Turbidity
The after image depicts two areas of high turbidity to
the left and right of the hurricane track in the vicinity of Cape
Hatteras, North Carolina. One is centered in Pamlico Sound,
North Carolina while the other is slightly offshore.
The high turbidity in Pamlico Sound is expected due to
its shallow bathymetery but the region offshore is very unusual.
It perhaps indicates an area of well mixed water
that is cooler than the surrounding region as seen in the SST
after image.
| Before | After | Difference (after minus before) |
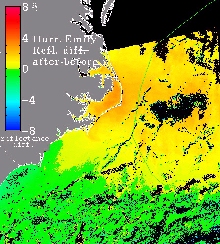
Sea Surface Temperature
Cooling in the Gulf Stream region is apparent in the after
image. The difference image reveals cooling on the order
of 1-4 °C but some areas depict cooling up to 7 °C .
The cooling in the area associated with the large turbidity spike
offshore is difficult to ascertain due to clouds in the before
image but appears to be large.
| Before | After | Difference (after minus before) |
For scientists more time series Satellite Images in GEOTIFF Format
are available